


The aim of this project is to practice what I learned in regards to data scraping, data cleaning, and data visualization.
The international breweries' data for some African countries containing their sales for a period of 3 years 2017, 2018, and 2019 was gotten.
The data was cleaned using power bi to check for empty cells, and duplicate entries to make sure that it is well aligned and in the correct order. This was achieved using the Transform data option of the power bi where it was discovered that the data set is clean and ready for visualization. Attached is a screenshot of the dataset and visualization respectively.
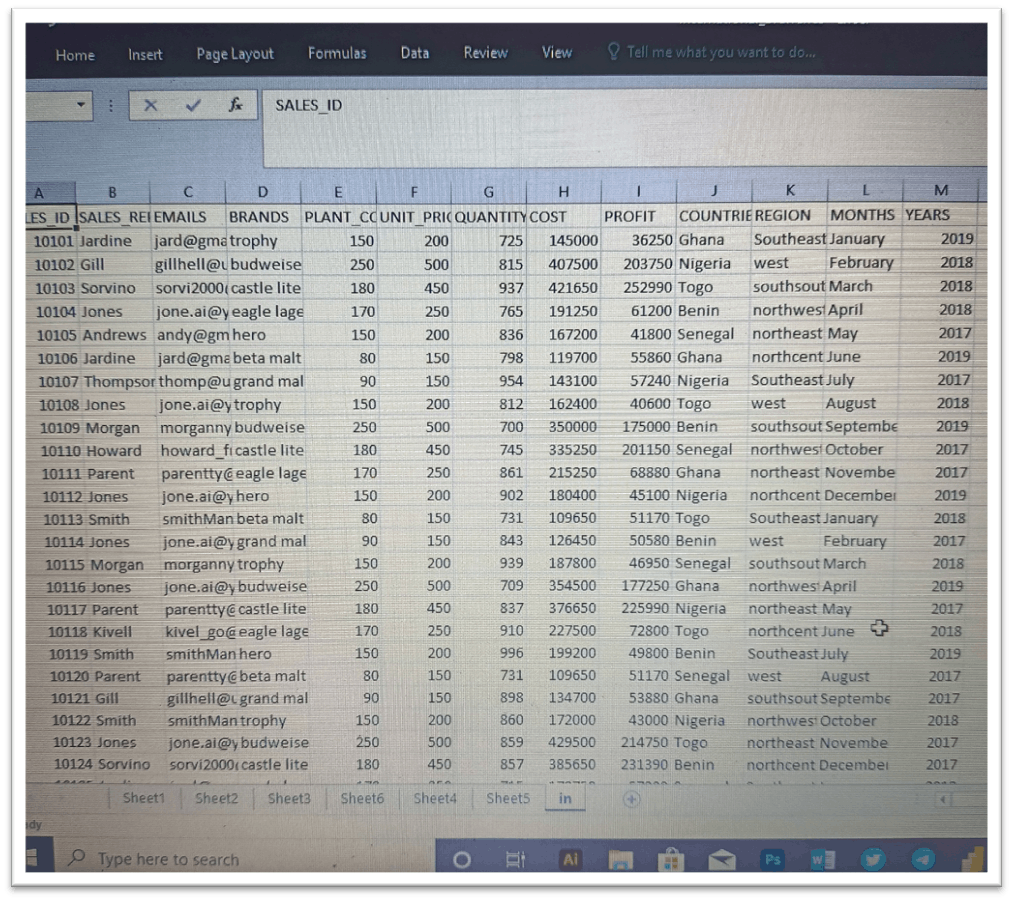
Data visualization is the representation of our findings in a graphical form for easy understanding. The visualization was done using Microsoft excel.
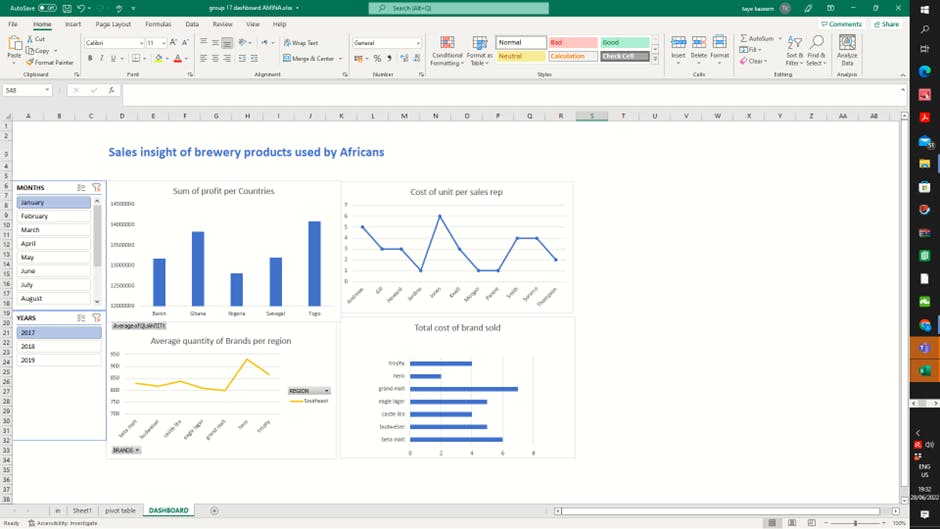
Analysis
- Jones is the company’s top sell rep within the period of the 3 years considered across all zones.
- Castle lite yielded the highest profit for the company through these 3 years
- Senegal comes tops as the country with the highest profit in 2018
- Beta malt gained the highest sales in the northcentral region
- In general, the company realized a total profit of $105587420 within these 3 years.
image source: jesrestaurantequipment.com/most-consumed-be..
Thank you for reading